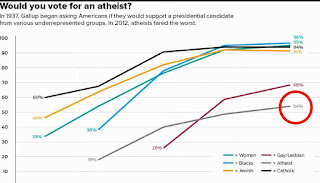
Note, that at the time, a black, gay, lesbian or atheist President is not something they even considered asking about. Catholic, Jewish or a woman, that’s it. And women did not do too well. Women rose steadily, probably due to their prominence in the war and work efforts around World War II. They started including blacks and atheists after that war as those were both things being talked about. Blacks started out low, but the civil rights movement moved them up within a few decades. Anyone who reads anything about that time knows this was no easy ride for any of these groups. Finally, somewhere around the 60’s it was recognized that Gay/Lesbian is also a category that someone might answer “yes” to.
I could say a lot more about the two groups who are still polling low, and there are other polls where Muslims come in around the 50% or less level too. I’ll link the talk, where Hemant Mehta did talk about it. What really struck me though is this is the dream of democracy and diversity coming true. Another 100 years earlier, just about anywhere in the world, the only people who could lead their country were people who had a royal blood line for that country. Either that or they killed whoever was there before. This question wouldn’t even make sense to the man on the street in feudal Europe or any other continent. Those two lower lines have continued to rise since 2012 and I believe it will not be that long before the strangeness of this question, because the answer is obviously “yes”, will be as strange as asking someone from a monarchy if they would support a king from a different country or of a different religion.
As a line graph, it looks like more and more people are crowding up at the top. But in terms of population the proportions of people hasn’t changed that much, it’s just that they can openly be who they are without needing to compromise and more of us are fine with all of us getting the benefits of working in and living in this modern world we’ve built. The 70% who once said “no” to these questions are seeing that it’s better to say “yes”. Granted some of them are no longer around but statistically this graph is showing people who changed their minds. Even the younger people participating had to learn this from somewhere. Culture does not usually change that fast, but lessons like this can be learned that fast.


No comments:
Post a Comment